Anxiety in PISA Survey 2015. Student
Questionnaire and
Possible Semantic Interferences in Bilingual Communities.
Franz Hilpold
Head
Teacher High School of Economics
franz.hilpold@gmail.com
Elita
Maule
Conservatory of Music of
Bolzano - Bozen, Italy
Elita.Maule@cons.bz.it
Markus Hilpold
Conservatory of Music of
Bolzano- Bozen, Italy
99hilmar@rgtfo-me.it
Summary
/ Abstract
PISA
research investigated the mathematical anxiety of
fifteen-year-old students in 2003 and 2012.
Subsequent
studies have confirmed the negative
correlation between anxiety and mathematical performance but have also
denounced how many issues remain unresolved about the reasons that lead
students to feel and declare different levels of anxiety. One
of these issues
interests the language and the translation, that is, the different
meanings
attributed to the questions by the students answering the
questionnaire. In
2015 PISA investigated the theme of school anxiety in general and not
only in
mathematics. By confirming the previous data, it appeared noticeable
that the
most anxious students are those of Spanish, Italian and Portuguese mother
language.
The
current research takes into account the incidence
of the linguistic variable on the anxiety index by assuming as a sample
a
bilingual (Italian and German) homogeneous Italian region in order to eliminate
other possible
variables such as socio-economic back-ground, school curricula
differences
teaching methodology, teacher training. The incidence of the 5 items
forming
the index in the selected sample was calculated by linear multiple
regression,
while the language influence on the
items was measured with a logistic regression. The results show that
the
language, controlling other variables of incidence, affects differently
but
always significant on the five items, namely, the
German speakers tend to deny high levels of
anxiety while Italian, Spanish and Portuguese speakers confirm it.
1. Introduction
The Programme for International Student
Assessment (PISA) is an international assessment study conducted by the
Organization for Economic Co-operation and Development (OECD) since
2000 and
investigates the level of competence acquired by 15-year-olds attending
all
types of school in the subjects: reading, mathematics and sciences.
Every three
years one of these disciplines is chosen as the main area of research,
while
the others, in turn, are taken as secondary dominions. In 2003 and in
2012 PISA investigated the student�s self-beliefs about their own
mathematics skills. Among them anxiety, but only
related to mathematics, was included as
�thoughts and
feelings about the self
in relation to mathematics,
such as feelings of helplessness and stress when dealing with
mathematics�
(OECD, 2012). Since then, the results of the PISA study on the subject
have
been deepened by numerous studies which
have confirmed that while Self-efficacy is positively associated with
student�s
math performances (Lee & Stankov,
2013),
anxiety is negatively associated with it (Kalaycıoğlu,
2015); while the socioeconomic status has a minor but
significant effect
only at school level, it doesn�t
influence the individual
math anxiety (Radi�ić
et.al,
2014). When poor early
math skills contribute to the development of math anxiety, other
factors seem
to increase it, such as quantity and quality of parent and teacher math input, social pressure and stereotypes (Foley et al., 2017).
Further research took also into consideration the relationship between
socioeconomic variables, school and classroom climate, motivation and
cognitive
aspects of learning math and math anxiety at both school and student
levels
proving that �achievement and interest
in mathematics, high
mathematics
self-concept, and school and classroom atmosphere are associated with a
lower
level of math anxiety [�]. Nevertheless, it is surprising
that the self-efficacy in solving everyday math problems, the
elaboration
learning strategies, and the intrinsic interest in mathematics do not
contribute to explaining of the math anxiety
variance� (Radi�ić
et.al, 2015, p.15).
Though PISA and other studies
have shown that math anxiety is a cross-national problem and that it
may depend
on several variables, various questions
remain unanswered. Little
is known about the most effective ways to address these issues in
different
cultural and school contexts and how teachers, parents and teaching
methods
transmit math anxiety to children. Moreover,
�in cross-country
comparisons, there are many confounding variables that contribute to
score
differences, such as national curricula, characteristics of the
language,
translation mistakes and cultural-specific experiences. To compare the
achievement levels of students who take different language versions of
an
assessment, the raw scores from each assessment should be transformed
into a
common scale� (Kalaycıoğlu,
2015).
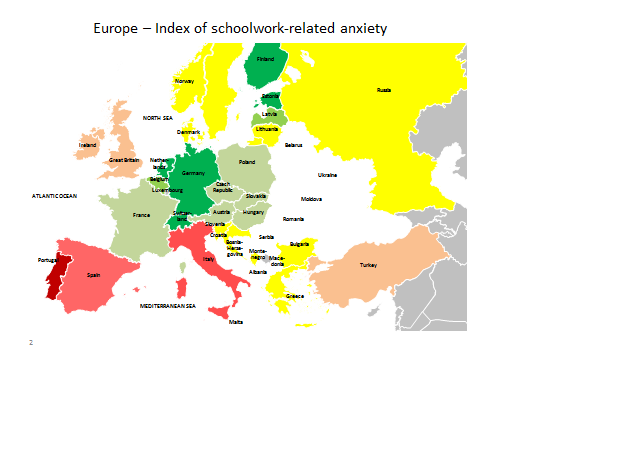
On the 18th of April
2017 OECD published the result of further investigations that were
carried out
on PISA 2015, which discussed mainly the wellbeing of students. (OECD,
2017a). One
of the most interesting variables is the index of schoolwork-related
anxiety.
The index of
schoolwork-related anxiety (ANXTEST) was constructed using student
responses to
question (ST118) over the extent they strongly agreed, agreed,
disagreed or
strongly disagreed with the following statements when asked to think
about him
or herself:
-
To
what extent do you disagree or agree about yourself? I often worry that
it will
be difficult for me taking a test.
-
To what extent do you
disagree or agree about
yourself? I worry that I will get poor <grades> at school.
- To
what extent do you disagree or agree about yourself? Even if I am
well-prepared
for a test I feel very anxious.
- I get
very tense when I study for a test.
-
I get
nervous when I don�t know how to solve
a task at school.
The index was
calibrated in such a way, that the OECD obtained a median of 0 and a
standard
deviation of 1 as result (OECD, 2017b). If the index of a country or a
region
had a positive value, then the anxiety of the students was greater than
the
OECD-average. Whereas if the index was negative, it meant that the
students
were worrying less than on the OECD-average. The Swiss, for instance,
have a
high negative value of -0.44 and are thus quite untroubled. The Italian
teenagers
instead, produce a high positive value of +0.45 and therefore show
stress
towards exams more distinctively, in comparison.
When single countries
such as in Europe are being compared, it can be noted, that especially
in
German speaking countries the index consists of moderately strong or
very
strong negative values, while countries with languages, that can be
retraced to
a Latin origin, have a positive Index value. For
comparison:
|
 |
|
<=
-0,30
|
|
|
-0,20
- -0,29
|
|
|
-0,10
- -0,19
|
|
|
-0,09
- +0,09
|
|
|
0,10
- 0,19
|
|
|
0,20
-0,29
|
|
|
0,30
� 0,44
|
|
|
>= 0,45
|
|
|
Image
1:
Europe-Map with
coloured index ANXTEST
This sparks the
suspicion, that even the linguistic phrasing of the multiple-choice
answer set
might have had an influence on the answers of pupils on the index
items. The
interaction with psychological pressure that emerges from the results
and that
is different in each country would therefore be relativised. It could
be that
the semantic content of the wording in German, for instance, is being
weighted
differently than in Italian or in Spanish for example.
Here are first of all the answer sets that
were made available in the surveys there to:
Table
1: Statements
in the five questions composing the index of anxiety
|
English
|
German
|
Italian
|
French
|
Spanish
|
|
I often worry that it will be difficult for me
taking a test;
|
Ich
mache mir oft Sorgen, dass ein Test/eine Schularbeit
f�r mich schwierig wird;
|
Mi preoccupo spesso che
avr�
difficolt� a fare un test
|
J�ai
souvent peur d�avoir des
difficult�s
�
r�ussir un
contr�le.
|
Con frequencia me preocupa que el examen me
resulte dificil
|
|
I worry that I will get poor
<grades> at school;
|
Ich mache mir Sorgen, dass ich in der Schule
schlechte Noten bekomme.
|
Mi preoccupa prendere brutti voti a scuola
|
J�ai
peur
d�avoir de mauvaises notes
�
l��cole.
|
Me preocupa sacar malas notas en clase
|
|
Even if I am well prepared for a test I feel
very anxious;
|
Auch wenn ich
f�r einen Test/eine
Schularbeit gut vorbereitet bin, habe ich
gro�e Angst davor.
|
Anche se sono preparato/a, quando devo fare un
test sono molto in ansia
|
M�me
si
je me suis bien
pr�par�(e)
pour un
contr�le, je me sens
tr�s
angoiss�(e).
|
Incluso cuando estoy bien preparado para un examen
me encuentro muy nervioso
|
|
I get very tense when I study;
|
Ich werde ganz verkrampft, wenn ich
f�r einen Test/eine Schularbeit lerne.
|
Divento molto teso/a quando mi preparo per un test
|
Je suis
tr�s tendu(e) quand
j��tudie
pour un
contr�le.
|
Me pongo muy tenso cuando estudio para un examen
|
|
I get nervous when I
don�t know how
to solve a task at school.
|
Ich werde
nerv�s, wenn ich in der
Schule eine Aufgabe nicht l�sen kann
|
Divento nervoso/a quando non so come fare un
compito a scuola
|
Je deviens
nerveux/nerveuse quand je ne sais pas comment
r�soudre un
�
|
Me pongo nervioso cuando no
s� resolver
un ejercicio en clase
|
In order to better
determine the structure of data and to find out, if the construct
ANXTEST
represents a real existing condition of a person, regarding a task that
has to
be solved, we first of all inspected what influence the single
variables
(=questions) have on the index. PISA created the index out of these 5
items,
and each item contributes to the creation of the index, due to its
properties
of distribution in the entire OECD sample. We can expect, that the
distribution
properties of the agreement/ strong agreement, together with the
disagreement/strong disagreement vary in each country, and it is not
only the
frequency of agreement that matters but also its degree (agree/strongly
agree).
One must take into
consideration that culturally- and socially conditioned response sets
will appear.
For example they might have a tendency/aversion towards the middle, a
tendency
towards acquiescence etc. which might worsen the validity of the
construct.
PISA took this into consideration when they formed the index, and
therefore
summarised the agree/strongly agree answer expressiveness. As a result
dummy-variables were built. We rely on the same process in our
research. Thus,
we especially avoid response sets, which compromise the result of the
item
answers regarding the person property that has to be measured i.e which
makes
it unreliable. Furthermore we simplify the investigation and can
therefore
expect a more accessible recognition of structure.
An interesting field of
research are areas, in which questionnaires have been filled out under
the same
or similar conditions but in different languages. Such areas would be
Switzerland (German, French, and Italian), Luxembourg (German, French,
and
English), Friuli-Venezia Giulia in Italy (Italian and Slovenian) and
South
Tyrol (German and Italian).
The analysis of the
case of South Tyrol is interesting, because a census of all 82 schools
has been
carried out. The students have been chosen based on PISA-criteria in
the
schools themselves. We are therefore looking at a representative sample
that
fulfils all criteria, which are also required from each OECD-country in
order
to be inspected as an independent entity. In South Tyrolean schools,
students
of German schools answer the questionnaire in German, students of
Italian
schools fill out the questionnaire in Italian, and in Ladin valleys
students
are allowed to pick either language to fill out the questionnaire. The
sample
is very suitable for this kind of analysis also because there were few
missing
values and because the questionnaires were filled out responsibly. When
the
answer pattern in different languages are being explored, it is useful
that the
schools and the school system work under the same conditions, that the
teacher
training follows the same jurisdiction and that the syllabi are more or
less the
same.
We focused our research
especially on South Tyrol, because the statistical statements can be
secured
quite well there.
2. The impact of language on the answers to
index
ANXIETY questions
Table
2: Comparison of the index ANXIETY between
some countries and linguistic
groups (OECD, 2017)
|
Country/linguistic
group
|
Value
of Anxiety-Index
|
|
SouthTyrol
german speaking schools
|
-0,386
|
|
SouthTyrol
italian speaking schools
|
+0,283
|
|
SouthTyrol
ladin speaking schools
|
-0,250
|
|
South
Tyrol entirely
|
-0,23
|
|
Italy
|
0,45
|
|
Austria
|
-0,10
|
|
Germany
|
-0,33
|
|
Switzerland
|
-0,44
|
|
Trentino
(Italy)
|
0,21
|
|
Campany
(Italy)
|
0,53
|
|
Lombardy
(Italy)
|
0,37
|
|
OECD
average
|
0,01
|
It can be noted, that
South Tyrol is one of the few areas in Italy that has a distinct
negative value
in the ANXTEST index. This is due to the fact, that the German
population,
which has a negative result is greater than the Italian population
which has a
positive result, as a result the negative result overpowers the
positive one.
This will be inspected properly in the following table:
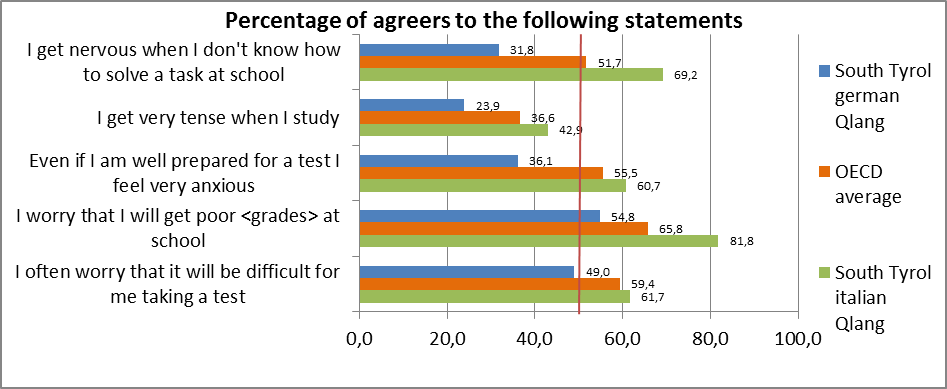
Image
2: Percentage of agreers in the five index
questions between the test language groups in South Tyrol
(OECD,
2017a)
Using the PISA
�
standard errors (OECD, 2003) we note, that for each item ST118Q01 to
ST118Q05
the difference between the distribution of agreers/disagreers in both
language
groups german and italian results significant at the level 0,05.
For each question, moreover, the german and the
italian frequency of agreers have a different position regarding the
OECD
related frequency of the agreers. The german speaking students stand
always on
the left side of the OECD average, whereas the italians are always on
the right
side.
The first research
question, according to that, reads as follows: Do the single items have
the
same (H0) or do they have a different impact (H1) on the index? Out of
practical reasons we carried out the investigations without any
limitation from
generality on some countries, which are relevant for further research.
It
seemed to us that the most direct- and most comprehensible method was
the one
of the multiple regression (Bortz & Schuster, 2010) of the
single questions
ST11801 to ST118Q05 carried out to form the ANXTEST index.

Image
3: Distribution of Test Anxiety in South Tyrol
by questionnaire language
2.1 Multiple regression of the ST118 questions
on the
variable ANXTEST � weighted data South Tyrol
Given
circumstances: Census on every school which contains 15-year-olds,
sample within
the schools following the PISA-rules. Sample size: 2243 persons,
weighted with
(Final trimmed nonresponse adjusted student weight)=4985.
The dependant
variable is interval-scaled and the independent variables are coded as
dummy-variables (0=strongly disagree/disagree, 1=agree/strongly agree).
The
interrelation between the single predictors and the criterion is
approximately
linear (dummy-variables)
The variables
Q05, Q01, Q04, Q03 and Q02 are inserted into the model
(method:inclusion)
respectively.
Table
3: Model Summary after insert the questions Q01 to Q05
|
Model
Summaryc
|
|
Model
|
R
|
R
Square
|
Adjusted
R Square
|
Std. Error of the Estimate
|
Durbin-Watson
|
|
1
|
,903a
|
,816
|
,816
|
,4544652
|
.b
|
|
a. Predictors: (Constant), New dummy 118Q05:I
get nervous when I don't know how to solve a task at school., New dummy
118Q01:To what extent do you disagree or agree about yourself? I often
worry that it will be difficult for me taking a test., New dummy
118Q04:I get very tense when I study for a test., New dummy 118Q03:To
what extent do you disagree or agree about yourself? Even if I am
well-prepared for a test I feel very anxious., New dummy 118Q02:To what
extent do you disagree or agree about yourself? I worry that I will get
poor <grades> at school.
|
|
b. Not computed because fractional case weights
have been found for the variable specified on the WEIGHT command. For
unweighted data the
Durbin-Watson statistic results 1,981.
|
|
c. Dependent Variable: Personality: Test
Anxiety (WLE)
|
81,6 % of the
index variance are explained by questions Q01 to Q05. Since the
Durbin-Watson-value of the unweighted data is 1,981, it can be assumed,
that
the error values are uncorrelated (The Durbin-Watson values are between
0 and
4. Independence is given in the middle, at 2).
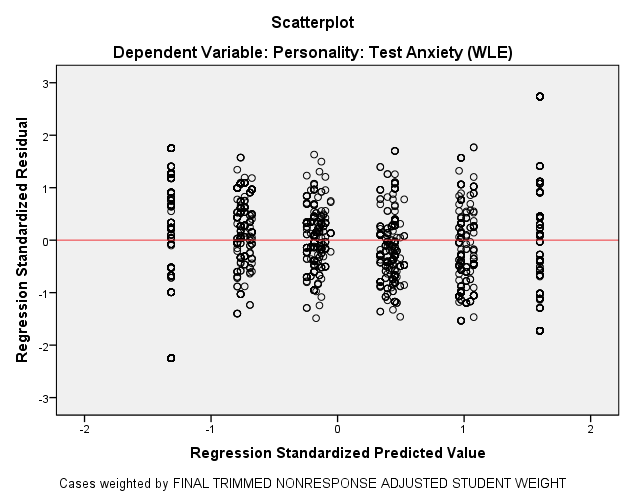
Image
4: Regression of the standardised Residuals of ANXTEST on the
standardised
predicted values
In the diagram
of standardised residues it can be read, that there is a high
probability of
homo-scedasticity. In fact the Breusch-Pagan test of heteroscedasticity indicates that
the H0 - hypothesis,
regarding Homoscedasticity being given, cannot be rejected.
As a result of
this regression the following linear model for ANXTEST is obtained:
ANXTEST = -1,483+0,566*Q01
+ 0,526*Q02
+ 0,611*Q03 +0,596*Q04
+0,500*Q05
Or standardised, with the standardised
variables: Q�01
�
Q�05
ANXTESTstd= 0,262* Q�01
+
0,241* Q�02 +
0,285* Q�03
+ 0,255* Q�04 +
0,233* Q�01
All regressors
are highly significant.
The questions
equally contribute to the formation of the index, the differences are
very
small. Q03 is the question that has the greatest influence on the
index. The
answers to the Q05 are the ones who have the smallest impact on the
index.
Overall the
model clarifies 81,6% (highly significant) of the independent variable
variance,
as we saw above. An effect force of 2,11 indicates, that the
coefficient of
determination is relevant.
2.2 Insert the language in the model
If we integrate
the questionnaire language, coded as dummy-variable lang,
in the model, no additional variance will be explained.
ANXTEST
= -1,482+0,554*Q01+0,529*Q02+0,613*Q03+0,597*Q04+0,505*Q05�
0,022*lang
In standardised form:
ANXTESTstd = 0,261*
Q�01+0,242*
Q�02+0,286*
Q�03+0,255*
Q�04+0,235*
Q�01-0,009*langstd
The explained variance
of the model does not change and remains at 81,6%. While all the
regressors
from the items Q01 to Q05 are highly significant and can be found on
the niveau
of 0,001, this is not the case for the variable lang (significance
niveau 0,177
in the model).
From this we can
deduce, that a big section of the explained variance of the index
�schoolwork-related
anxiety� is already present in
the questions that form the
index, due to the questionnaire language. The collinearity between lang
and the
index items has as a result a certain size, but a high tolerance
(values between 0,7 and 0,9) and a moderate variance inflation factor
show that
that the model is valid.
2.3 The impact of questionnaire language on
each Index
question
Under the given
circumstances we will carry out an investigation concerning the impact
of the
questionnaire language on the five dichotomic items that form the
index. In
this case, the language will have the function of independent variable
and the
items will be the criterion variable and will be analysed separately.
The
question is, if the questionnaire language has an influence on the
answering of
index forming statements that is at least partially independent, or if
third
variables are exclusively responsible for the variance of each
corresponding
criterion. In case an independent influence is present, the varying
intensity,
which allows the influence to have an impact on every criterion
variable, will
be of interest.
We will choose
the logistical regression (Bortz & Schuster, 2010), because the
linear
regression would not be suitable for the dichotomic criterion variable.
In order to
simplify the model the variable questlang with the range 0 =
�german�
and 1 =
�Italian�
was created out of the variables
LANGTEST_QQQ =�Language of
Questionnaire� with the range 148 =
�german�
and 200 =
�Italian�.
The
distribution of both
variables is
obviously identic, because only a recoding was carried out.
To inspect the
influence of the test language on each item a cross table for each item
was
build. As an example below a crosstable for the item Q01 is shown.
Table
4: Cross table of distribution between agreers
and disagreers in both questionnaire languages german and italian for
the item
Q01
|
questlang =dummy from LANGTEST_QQQ * New dummy
118Q01:To what extent do you disagree or agree about yourself? I often
worry that it will be difficult for me taking a test. Crosstabulation
|
|
% within questlang =dummy from LANGTEST_QQQ
|
|
SYSMIS: 68 (1,36%) -
In brackets: valid cases
|
New dummy 118Q01:To what extent do you disagree
or agree about yourself? I often worry that it will be difficult for me
taking a test.
In brackets: S.E.
|
Total
|
|
|
|
str. disagr./disagr.
|
agree/strongly agree
|
|
questlang
=dummy from LANGTEST_QQQ
|
German (3689)
|
50,5% (1,3)
|
49,0% (1,35)
|
99,5%
|
|
Italian (1228)
|
37,4%
(2,2)
|
61,7%
(2,2)
|
99,1%
|
|
Total
valid cases
4917
|
47,5%
|
52,5%
|
100,0%
|
This table
represents a four-fields-table with marginal distributions. The share
complement one other to 100%. If we consider the four-field-table as a
2x2-matrix,
we can calculate a determinant of the share of each variable. The
determinant
can taken as a measure for the
difference
on distribution of two variables.This is an easy and fast way to get a
general
idea about a rough estimate of difference in the distribution of a
variable in
two part of the population. The determinant of the distribution
matrices was
calculated to discover the biggest difference between the answers of
both
language groups.
In the case of Q01 the determinant is
0,505*0,617 �
0,490*0,374 = 0,124790. The bigger is the absolute value of the
determinant,
the greater is the difference of the share of both variables. The
determinant
varies from -1 to 1. If a equal distribution in both groups is given,
the
determinant is 0.
The determinant of each variable Q01 to Q05 is:
Q01: 0,124790
Q02: 0,269214 Q03: 0,247888
Q04:
0,189148 Q05:
0,372654.
We note, that the test language causes the
biggest
share in the question Q05 within the
distribution of agreers/not agreers. Therefore we inspect deeper the
influence
of language on the answers to the question Q05.
2.4 Results of
the logistic regression of the variable questlang on
the criterion Q05
Table
5: Chi-square �Table
Model
Coefficients Q05
|
Omnibus Tests of Model Coefficients Q05
|
|
|
Chi-square
|
df
|
Sig.
|
|
Step
1
|
Step
|
545,324
|
1
|
,000
|
|
Block
|
545,324
|
1
|
,000
|
|
Model
|
545,324
|
1
|
,000
|
The model chi-square value is the difference
between
the 0-model (without predictors) and
the
predictor-model. The hypothesis H0 that the
slope of the predictor lang_quest is 0 must be rejected (p
< 0,05). The
predictor contributes therefore significatively at increasing the
goodness of
model fit.
The observed model is better than the 0-model
which
contains only the constant.
Table
6:
Model Summary Q05
|
Model
Summary Q05
|
|
Step
|
-2
Log likelihood
|
Cox
& Snell R Square
|
Nagelkerke
R Square
|
|
1
|
6118,287a
|
,105
|
,142
|
|
a. Estimation terminated at iteration number 3
because parameter estimates changed by less than ,001.
|
The Nagelkerke R2
(Nagelkerke, 1991) is with 14,2 % relatively important (this value
is
rarely high). This means that the error - reduction obtained with the
entering
of language in the model measures 14,2%.
Table
7:Hosmer and Lemeshow Contingency Table
|
Contingency Table for Hosmer and Lemeshow Test
|
|
|
ST118Q05NW
= strongly disagree/disagree
|
ST118Q05NW
= agree/strongly agree
|
Total
|
|
Observed
|
Expected
|
Observed
|
Expected
|
|
Step
1
|
1
|
2503
|
2503,271
|
1179
|
1179,002
|
3682
|
|
2
|
369
|
368,891
|
858
|
858,476
|
1227
|
The Hosmer and Lemeshow Contingency Table shows
us the
observed values and the associated expected values. We can see, that
the
accordance is quite perfect.
Table
8: Classification Table
|
Classification
Tablea
|
|
|
Observed
|
Predicted
|
|
|
New dummy 118Q05:I get nervous when I don't
know how to solve a task at school.
|
Percentage
Correct
|
|
|
strongly
disagree/disagree
|
agree/strongly
agree
|
|
Step
1
|
New dummy 118Q05:I get nervous when I don't
know how to solve a task at school.
|
strongly
disagree/disagree
|
2503
|
369
|
87,2
|
|
agree/strongly
agree
|
1179
|
858
|
42,1
|
|
Overall
Percentage
|
|
|
68,5
|
|
a. The cut value is ,500
|
The overall percentage about 69% is moderate but
acceptable. 87% of
disagreement cases were predicted correctly, but only 42% of the agreer
were
classified in the right way.
Table
9: Variables in the Equation with Q05
|
Variables in the Equation Q05
|
|
|
B
|
S.E.
|
Wald
|
df
|
Sig.
|
Exp(B)
|
|
Step
1a
|
questlang_dummy
|
1,598
|
,072
|
498,169
|
1
|
,000
|
4,941
|
|
Constant
|
-,753
|
,035
|
454,376
|
1
|
,000
|
,471
|
|
a. Variable(s) entered on step 1:
questlang_dummy.
|
The logistic
regression equation is : logit(x) = - 0,753 + 1,598 * x, where in this case x =
questlang_dummy. The
probability of the assignement can be calculated by
.
In
this way we can calculate that the
probability, that a person with the questlang_dummy = 1 falls in the
group with
the Q05 = 1 is 70 %.
The Exp(B) shows
that passing from 0 to 1 in
questlang increase
3,9 times the
probability to get 1 in the statement Q05. This means by the change
subgroup
from german to italian the probability to agree to the statement
increase 3,9
times. All results
are significant.
The logistic
regression of the variable questlang_dummy was also carried out for the
other
statements in the same manner. Due to lack of place we will only show
the
results in form of odd ratios Exp(B) (in brackets the constant):
Exp(B)(Q01):
1,703
(0,970) Exp(B)(Q02): 3,884 (1,237) Exp(B)(Q03):
2,829 (0,570)
Exp(B)(Q04):
2,411 (0,316) .
The influence of
the language is also present in these four variables. The impact that
the
language has on variables Q01 to Q04 is nevertheless smaller than on
Q05, but
the variable Q05, on the other hand, does not contribute as much to the
explained index variance. Hence we can deduce, that the variable Q05
does not
contribute to the anxiety issue as much as the other statements, but it
puts
more emphasis on the separation of the index regarding language groups.
After showing
the clearly stochastic influence of language on the statement �I
get nervous
when I don't know how to solve
a task at school� we have to control,
if other variables
influence the
statements leading to the anxiety index. Following the PISA 2012
studies there
are several variables allowed to influence the anxiety. In PISA 2012 it
was the
anxiety in mathematics, which was studied in detail. We assume that
several of the
same behavioural or field variables can be associated to general anxiety related to the schoolwork
that is studied in
PISA 2105.
2.5 Insert background
and behavioural variables in the model
We now introduce
in our model the following variables: GENDER, ESCS = economic, social
and
cultural status, HISEI = highest parental occupational status, BELONG =
Subjective
well-being: Sense of Belonging to School (WLE = Warm Likelihood
Estimate),
MOTIVAT = Achieving motivation (WLE), IMMIG = Index Immigration status,
STUBEHA
= Student-related factors affecting school climate (WLE), TEACHBEHA =
Teacher-related
factors affecting school climate (WLE), questlang = language of student
questionnaire. The criterion remains ST118Q05.
Table
10:New Variables in the Equation
|
Variables
in the Equation
|
|
|
B
|
S.E.
|
Wald
|
df
|
Sig.
|
Exp(B)
|
|
Step
1a
|
questlang_dummy
|
1,507
|
,105
|
206,417
|
1
|
,000
|
4,512
|
|
TFGender
|
-,455
|
,089
|
26,151
|
1
|
,000
|
,635
|
|
ESCS
|
,076
|
,099
|
,589
|
1
|
,443
|
1,079
|
|
BELONG
|
-,188
|
,043
|
19,070
|
1
|
,000
|
,829
|
|
MOTIVAT
|
,300
|
,049
|
37,282
|
1
|
,000
|
1,350
|
|
hisei
|
-,005
|
,004
|
2,064
|
1
|
,151
|
,995
|
|
IMMIG
|
-,016
|
,102
|
,024
|
1
|
,876
|
,984
|
|
STUBEHA
|
-,108
|
,067
|
2,603
|
1
|
,107
|
,898
|
|
TEACHBEHA
|
,182
|
,065
|
7,855
|
1
|
,005
|
1,200
|
|
Constant
|
,412
|
,271
|
2,302
|
1
|
,129
|
1,509
|
|
a. Variable(s) entered on step 1:
questlang_dummy, TFGender, ESCS, BELONG, MOTIVAT, hisei, IMMIG,
STUBEHA, TEACHBEHA.
|
In this table we
can see that only the variables questlang, TFGender, Belong, Motivat
and
Teachbeha have a significant influence on the answering of the Q05
question.
The questionnaire language has with these variables the greatest
impact, as we
can read from the value EXP(B). Although the motivation and the teacher
behaviour still have a noticeable probability to influence the
acquiescence
behaviour, it is smaller concerning the Belong variable. The negative
algebraic
sign of the TFGender variable indicates, that girls are more likely
than boys
to admit that an assessment at school makes them anxious.
The variance
clarification as a whole has a value of 69% and is therefore not much
greater
than as it was before the additional variables were introduced.
2.6 Other Examples
We can find
similar results in other situations, where in the same area items about
anxiety
have been given to students in different questionnaire languages. Such
an
example would be Switzerland.
Table
11: The index ANXTEST in Switzerland
|
MEAN and SE of ANXTEST by LANGTEST_QQQ
|
|
|
LANGTEST_QQQ
|
statistic
|
ANXTEST
|
se_ANXTEST
|
N_cases
|
NU_cases
|
NU_psu
|
|
1
|
german
|
MEAN
|
-,585
|
,016
|
53798,21
|
3481
|
1
|
|
2
|
italian
|
MEAN
|
-,071
|
,041
|
3332,97
|
1018
|
1
|
|
3
|
french
|
MEAN
|
-,165
|
,034
|
24005,41
|
1288
|
1
|
While the French
speaking teenagers stand out from the OECD-average, with their
disagreement
regarding the school-related anxiety and the German ones stand out even
more,
the index of the Italians has a range that stay in proximity of the
OECD-average.
In Luxembourg we
have also a differentiation between questionnaire languages:
Table
12: The index ANXTEST in Luxembourg
|
MEAN and SE of ANXTEST by LANGTEST_QQQ
|
|
|
LANGTEST_QQQ
|
statistic
|
ANXTEST
|
se_ANXTEST
|
N_cases
|
NU_cases
|
NU_psu
|
|
1
|
german
|
MEAN
|
-,236
|
,018100
|
3764,74
|
3619
|
1
|
|
2
|
english
|
MEAN
|
,116
|
,073446
|
230,30
|
216
|
1
|
|
3
|
french
|
MEAN
|
,009
|
,025618
|
1457,95
|
1382
|
1
|
Also the results
of the Ladins in South Tyrol are interesting, as students from same
classes
filled out the questionnaires in part in different languages. Even here
the
result turns out to be, that Italian Questionnaire answers tend to
emphasise
the presence of anxiety more strongly than German ones.
3. Conclusion
The difference
in the answer pattern between language groups that attend school in the
same
context is evident. Altough there might be culturally conditioned
response sets
present, the fact that analyzed students of different language groups
sometimes
attend the same school and the same boundary condition in the analysed
sample
exclude a series of disturbing factors: Different school levels, school
programs and teacher training are influence variables that can be
disregarded.
We cannot, due to the research discussed above, reject the hypothesis
that the semantics
of the questioning in the different languages had an impact on the
answer
pattern, i.e. the semantics of the questioning in different languages
have a
considerable probability of influencing the answer pattern. Thus
resulting in a
less reliable validity regarding tests that have been internationally
standardised. The
weight that the meaning
attribution has in the questions and statements, especially the ones
regarding
attitudes and behaviours towards answer patterns should be analysed
more
thoroughly in international inquiries.
Literature
[1]
Bortz, J., Schuster, C. (2010). Statistik f�r
Human- und
Sozialwissenschaftler. Berlin,
Heidelberg: Springer.
[2]
Foley,
A. E., Herts, J. B., Borgonovi, F., Guerriero, S., Levine, S. C., & Beilock,
S. L. (2017). The
Math Anxiety-Performance Link: A Global Phenomenon. Current
Directions in Psychological Science, 26(1),
52�58.
[3]
Kalaycıoğlu, D.
B. (2015). The
Influence of Socioeconomic Status, Self-efficacy, and Anxiety on
Mathematics
Achievement in England, Greece, Hong Kong, the Netherlands, Turkey, and
the
USA. Educational
Sciences: Theory & Practice,
15(5), 1-11.
[4]
Lee, J.,
& Stankov, L. (2013).
Higher-order structure of noncognitive constructs and prediction of
PISA 2003
mathematics achievement. Learning and Individual Differences, 26,
119�130.
[5]
Nagelkerke,
N.J.D. (1991). A note on a general definition of the coefficient of
determination. Biometrica, 78 (3),
691-692.
[6]
OECD
(2005). PISA 2003 Technical
Report, OECD Publishing.
[7]
OECD (2013). PISA
2012 Results: Ready to learn. Students�
Engagement, Drive and Self-Beliefs. Vol.
III,
OECD Publishing.
[8]
OECD (2017 a). PISA 2015 Results: Students' Well-Being.Volume III,
OECD Publishing
[9] OECD (2017
b). PISA 2015
Technical Report, OECD Publishing.
[9]
Radi�ić,
J., Videnović,
M., & Baucal, A. (2014).
Math Anxiety. Contributing School and Individual Level Factors. European Journal of Psychology of Education,
30 (1), 1-20.
Short
presentation of the authors
Franz Hilpold, head of a high school of economics, now
retired, directed
the school-evaluation office of the autonomous province of South Tyrol
from
2004 to 2012. In 1996 he carried out the TIMSS-Study in South Tyrol and
has
provided for the elaboration of PISA �
data from 2003 to 2012
for his
competence area. He collaborates with several institutions regarding
school-evaluation issues.
Elita Maule, PhD (University of Fribourg-CH), Professor at the Music
Conservatory of
Bolzano-Bozen, has been visiting professor
in a number of occasions at the University
of Trento, Padova,
Bologna, Bolzano and Hanoi in 2017. She has published several books,
essays and
articles specially
about didactic of
music and musicology also in international scientific
journals.
Markus Hilpold, graduating in music didactics at the
Conservatory of
Bolzano-Bozen �Claudio
Monteverdi�.